
Q1 FY27 GDP at 7.8%: War-Time Growth Print Explained with Exam-Ready Notes
In one line: Q1 FY27 GDP at 7.8% — the war-time growth print, decoded.
- 1. The Print: The Numbers and Their Comparisons
- 2. The Drivers: Manufacturing and Services
- 3. The War Backdrop: The Oil Shock and Its Unwinding
- 4. The Transmission Channels: How the War Reaches Indian Growth
- 5. The Honesty Tests: Base Effects and Deflators
- 6. How Exams Probe This Topic
- 7. Quick Revision: One-Glance Facts
- The Print in One Table
- Practice Corner: Five Definition Checks (with Answers)
- The Case Lens: Reading the Next Print
- The Three Classic Traps (Where Beginners Slip)
- Frequently Asked Questions
- What was India’s Q1 FY27 GDP growth?
- What drove the 7.8%?
- How did the US-Iran war affect this?
- Why is the base effect important here?
- What should be watched next?
- Exam Checklist
- FAQ
- How much of this page is exam-relevant?
- When should I revisit?
- The Thirty-Second Recap
- Explain It Simply
- Abbreviations That Recur Here
In one line: The April–June 2026 quarter grew 7.8% — manufacturing at 9.2% the spearhead, the pace above Q1 FY26’s 6.9% though below Q4 FY26’s revised 8.6%, and ahead of the RBI’s own ~7% Q1 projection — delivered through the US-Iran war’s oil shock (Brent’s 55% spike, the ceasefire’s 13–15% crash) and into a global slowdown: the print’s anatomy, the war’s transmission channels, the base-effect honesty, and the exam’s questions.
The GDP print stands on four counts. First, the numbers — the headline, the drivers, the comparison base. Second, the war context — the oil shock the quarter absorbed. Third, the analytical layer — what the print does and does not establish. Fourth, the exam layer — prelims facts, mains frames, interview depth.
Contents
1. The Print: The Numbers and Their Comparisons
2. The Drivers: Manufacturing and Services
3. The War Backdrop: The Oil Shock and Its Unwinding
4. The Transmission Channels: How the War Reaches Indian Growth
5. The Honesty Tests: Base Effects and Deflators
6. How Exams Probe This Topic
7. Quick Revision: One-Glance Facts
– Practice Corner: Five Definition Checks (with Answers)
– The Case Lens: Reading the Next Print
Quick Answer: India’s GDP grew 7.8% year-on-year in Q1 FY27 (April–June 2026) — faster than Q1 FY26’s 6.9%, slower than Q4 FY26’s revised 8.6%, and above expectations (the RBI’s August MPC had framed FY27 near 6.6–6.7% with Q1 around 7%). Manufacturing grew 9.2% with services strong — the supply-side spearheads. The achievement’s context is the US-Iran war of early 2026: Brent crude surged 55.3% (from $72.48 to $112.57 a barrel) at the war’s onset, the ceasefire (later 2026) crashed prices 13–15% with the Congressional Research Service finding prices back near pre-crisis within months — yet, at the ceasefire mark, Brent remained about a third above February levels before the subsequent unwinding. RBI Governor Malhotra noted the post-ceasefire lower crude would help stabilise inflation. The print’s honest reading: a genuine manufacturing-and-services acceleration, flattered by the low Q1-FY26 base (6.9%), achieved despite an oil shock that history (1991, 2013) treats as India’s classic vulnerability.
1. The Print: The Numbers and Their Comparisons
- The headline. GDP growth of 7.8% in Q1 FY27 (April–June 2026), released 1 September 2026 — the first quarterly print of the financial year, and the first full quarter carrying the war’s economic weight.
- The comparison set. Against Q1 FY26’s 6.9% — a strong acceleration year-on-year; against Q4 FY26’s revised 8.6% — a sequential moderation from an exceptional quarter; against the RBI’s projections — a clear beat (the August MPC had projected FY27 at roughly 6.6–6.7%, with Q1 near 7% per the quarterly path).
- The GDP-versus-GVA distinction. GDP (the demand side plus net indirect taxes) against GVA at basic prices (the supply side) — the two move together but diverge when tax collections swing; every mains answer on a GDP print should name both, and the exam’s conceptual question (define the difference) recurs every cycle.
- The “fastest major economy” frame. At 7.8% India remains the fastest-growing major economy — the standing context, with the caveat that the comparison set (China, the US, the eurozone) is itself slowing amid the war’s global drag.
2. The Drivers: Manufacturing and Services
- Manufacturing at 9.2%. The print’s spearhead — consistent with the capex-and-investment momentum the PLI schemes, infrastructure push and corporate-bank credit have built through 2025-26; the manufacturing share’s rise the “make-in-India” arithmetic the mains answer tracks.
- Services strong. The services composite (finance, trade, hotels, IT) carried the rest — the IT sector’s revival, the domestic demand resilience, the GST collections’ corroboration (an indirect-tax proxy the analysis cites).
- The demand-side reading. Private consumption steady, investment the accelerator, government capex supportive, exports the wildcard (the war’s global-demand drag the offsetting risk) — the four-way demand decomposition the standard mains frame demands.
- What the print does not establish. One quarter is not a trend: the “is this the start of a sustained 7.5%+ run” question needs two more prints; the monsoon, the oil price, and the global demand the three swing variables — the analyst’s honesty the interview values.
3. The War Backdrop: The Oil Shock and Its Unwinding
- The war. The US-Iran war of early 2026 — the conflict whose economic footprint the Congressional Research Service and market trackers have now mapped: Brent surged 55.3% within a month (from $72.48 to $112.57 a barrel), with market stress peaking around late March 2026.
- The ceasefire’s unwinding. The ceasefire announcement crashed Brent and WTI by 13–15%, equities soared, the Strait of Hormuz returned to “controlled movement” — with the CRS finding oil prices back near pre-crisis levels within a few months; yet, measured at the ceasefire itself, Brent remained roughly 31% above February’s level — a gap the following weeks’ unwinding then closed, US inflation had hit 3.3% in March — the truce fragile, the relief partial.
- The Indian marker. The LPG tanker Jag Vikram became the first Indian vessel to cross the Strait of Hormuz since the ceasefire — the shipping-lane’s reopening the visible arrow of the easing; the Red Sea’s earlier disruption (2024-25) the accumulated backdrop.
- The policy frame. RBI Governor Malhotra: the post-ceasefire lower crude would help stabilise inflation while fundamentals remain intact — the August MPC’s hold at 5.25% (this site’s August capsule carries the full decision) the monetary-policy setting into which this print lands.
4. The Transmission Channels: How the War Reaches Indian Growth
- The crude channel. India imports the overwhelming share of its crude — a $10-a-barrel sustained rise imports inflation, widens the current-account deficit, and pressures the rupee; the 2026 shock’s size (a ~$40 spike) was the classic stress test.
- The LNG-and-supply channel. LNG supply disruptions and shipping-cost spikes (the Hormuz-and-Red-Sea chokepoints) — the imported-input inflation the manufacturing sector absorbs.
- The finance channel. Risk-off capital flows, portfolio outflows, the rupee’s depreciation — the 2013-taper-style pressure the reserves (~two-thirds of a trillion dollars) cushion.
- Why the quarter survived. The war-shock’s partial unwinding (the ceasefire), the domestic-demand heft, the manufacturing momentum, and the inflation-targeting credibility — the resilience’s four legs; the mains question (“India’s growth is increasingly war-proof — critically examine”) the balanced answer’s frame.
5. The Honesty Tests: Base Effects and Deflators
- The base effect. The 7.8% rides on Q1 FY26’s 6.9% base — the same nominal momentum on a 8%-plus base would print lower; the year-on-year arithmetic’s flattery the analyst’s first discount.
- The deflator question. Real GDP = nominal minus the price deflator: with the war’s imported inflation, the deflator’s movement shapes the real print — the “is the real growth understated or overstated” nuance the advanced mains answer banks.
- The revisions’ humility. Q4 FY26’s 8.6% is itself a revised figure — the first prints get revised (the MOSPI’s routine); the exam-safe phrasing: “as per the first estimates”.
- The quarterly-path puzzle. FY27’s full-year arithmetic: a 7.8% Q1 against the RBI’s 6.6–6.7% FY27 projection implies either the RBI upgrades at the December review or the year decelerates hard — the trajectory question the next two prints will answer.
6. How Exams Probe This Topic
- Prelims MCQs: the headline number (7.8%), the quarter (April–June 2026 = Q1 FY27), the manufacturing figure (9.2%), the fastest-major-economy status, GDP-vs-GVA definitions, the Brent spike’s size and the ceasefire crash.
- Mains questions: “Analyse the drivers of India’s Q1 FY27 GDP growth and the risks to its sustainability”; “Examine the transmission channels through which the US-Iran war’s oil shock reaches the Indian economy, and the policy buffers that blunted it”; “A strong Q1 print is necessary but not sufficient evidence of trend growth — discuss with base-effect analysis”.
- The interview layer: GDP vs GVA vs NSO’s methods; why oil shocks hit India (the import dependence arithmetic); what the RBI can and cannot do about imported inflation — the three depth-probes the panel loves.
7. Quick Revision: One-Glance Facts
- The print. Q1 FY27 (Apr–Jun 2026): 7.8%; manufacturing 9.2%; vs Q1 FY26’s 6.9% and Q4 FY26’s revised 8.6%; released 1 September 2026; above the RBI’s ~7% Q1 path.
- The war. US-Iran war 2026: Brent $72.48 → $112.57 (+55.3%, ~one month); ceasefire crash 13–15%; near pre-crisis in months (CRS); still ~31% above February.
- The markers. Jag Vikram — first Indian tanker through Hormuz post-ceasefire; RBI Governor Malhotra on crude-and-inflation; the MPC’s 5.25% hold.
- The concepts. GDP vs GVA; base effects; deflators; the crude-CAD-rupee triangle; the fastest-major-economy frame.
Conclusion. The Q1 FY27 print is a genuine manufacturing-led acceleration delivered through an oil shock that history treats as India’s classic vulnerability — the war’s partial unwinding, the domestic heft and the policy credibility the resilience’s legs. Learn the number, the drivers, the war’s arithmetic and the base-effect honesty; the next two prints decide whether 7.8% was a launchpad or a peak.
The Print in One Table
| Indicator | Q1 FY27 | Reference |
|---|---|---|
| Real GDP growth | 7.8% | vs ~7.3% expected; RBI ~7% |
| Manufacturing GVA (real) | 9.2% | second straight strong quarter |
| Nominal GDP growth | 10.3% | deflator ~2.3% |
| Base comparisons | 6.9% (Q1 FY26) | 8.6% revised (Q4 FY26) |
Practice Corner: Five Definition Checks (with Answers)
- Q1 FY27 covers — April–June 2026, released 1 September 2026.
- The manufacturing growth in the quarter — 9.2%, the print’s spearhead.
- Brent’s war-time peak move — From $72.48 to $112.57 a barrel: a 55.3% surge within about a month.
- The ceasefire’s oil effect — A 13–15% crash in Brent and WTI, with Hormuz returning to controlled movement.
- GVA differs from GDP by — Net indirect taxes: GDP = GVA at basic prices + product taxes − product subsidies.
The Case Lens: Reading the Next Print
The next quarterly release’s checklist: the headline against this 7.8% and the base it sets; the manufacturing signal (sustained 9%-plus or mean-reversion); the oil variable (the ceasefire’s holding); the demand mix (investment’s share, exports’ drag); and the RBI’s December projection revision — five checks converting any GDP release into exam-ready analysis.
The Three Classic Traps (Where Beginners Slip)
The “war-proof” leap. One resilient quarter does not immunise the economy: the ceasefire’s fragility, the ~31%-elevated Brent and the global-demand drag the risks the balanced answer must carry.
The base-effect blindness. 7.8% on a 6.9% base is not 7.8% on an 8.6% base — the year-on-year arithmetic’s flattery the first discount every analysis applies.
The GDP-GVA conflation. They are different measures (the net-tax wedge); quoting one for the other the two-mark loss the definitions’ MCQ harvests every cycle.
Frequently Asked Questions
What was India’s Q1 FY27 GDP growth?
7.8% year-on-year (April–June 2026), released 1 September 2026 — above Q1 FY26’s 6.9%, below Q4 FY26’s revised 8.6%, and a beat over the RBI’s ~7% Q1 projection.
What drove the 7.8%?
Manufacturing (9.2%) with a strong services composite — the supply-side pair; on the demand side, investment momentum and steady private consumption, with the PLI-and-capex pipeline the structural backdrop.
How did the US-Iran war affect this?
Through the oil shock: Brent’s 55.3% spike (to $112.57) pressured inflation, the current account and the rupee; the ceasefire crashed prices 13–15%, easing the pressure — the quarter grew 7.8% despite the shock, the resilience’s headline.
Why is the base effect important here?
The 7.8% rides on Q1 FY26’s relatively modest 6.9%: the same momentum against a higher base would print lower — the year-on-year arithmetic the analyst’s first honesty test.
What should be watched next?
The ceasefire’s durability and the oil price; the next two prints’ manufacturing signal; the RBI’s December projection review; and the demand mix — the four variables that decide whether Q1 was a trend or a peak.
Related on hmmnm.in: Census 2027 and the Caste Count, Exam-Ready Notes · India AI Impact Summit 2026, Exam-Ready Notes · India’s BRICS Chairship 2026, Exam-Ready Notes
Read next: RBI’s Reforms Boost Financial Inclusion and Trade (or) Union Budget 2026-27: The Consolidating View
Exam Checklist
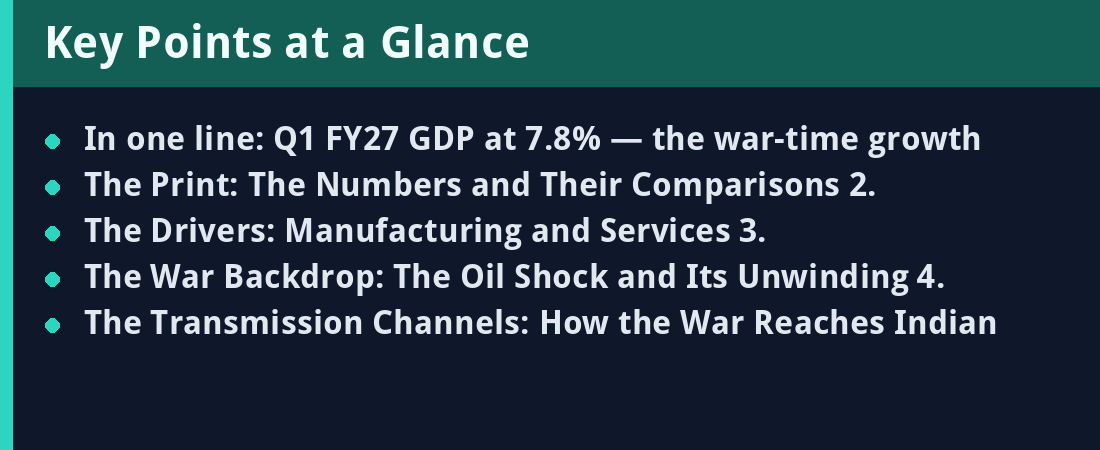
- Therefore, read once fully, then tables only
- Convert each heading into a question
- Speak five lines aloud as a briefing
- In addition, index one line in the fortnight sheet
- Return on day three and day seven

FAQ
How much of this page is exam-relevant?
Nearly all of it, because the tables and worked items follow the standard question register for this subject.
When should I revisit?
Day three and day seven after the first read, with the drill spoken aloud once.
The Thirty-Second Recap
One page. One topic. Therefore, read the tables twice. Speak the recap once. Moreover, the numbers carry the marks. The names carry the traps. However, revisits beat rereads. Finally, day three and day seven. That is all.
Explain It Simply
Think of this page as a map of one neighbourhood. The big streets are the tables. The landmarks are the numbers. The street names are the terms in bold. However big the city feels, this one neighbourhood fits in a pocket, and a pocket map is what exam week needs. Therefore, walk it once fully, then walk only the streets you forget, and by the second walk the neighbourhood feels like home.
Pocket the map, not the whole city: exams reward the walkable version of every topic.
Abbreviations That Recur Here
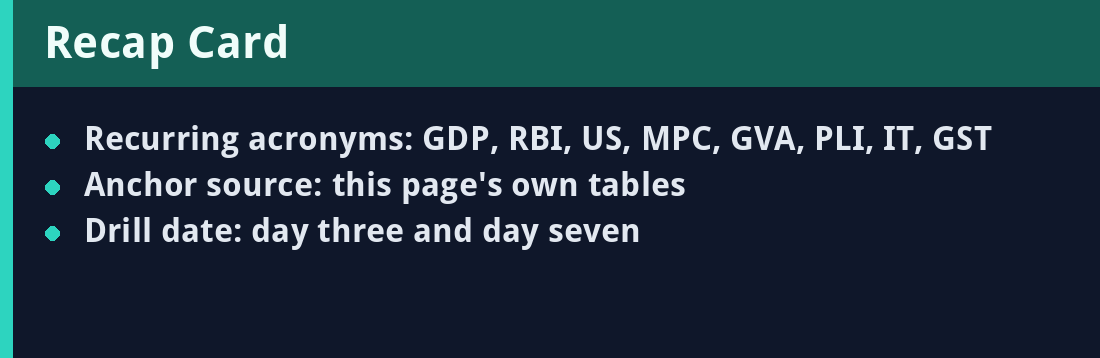
- GDP.
- US.
- MPC.
- PLI.
- IT.
Quick revision
- The headline.: GDP growth of 7.8% in Q1 FY27 (April–June 2026), released 1 September 2026 — the first quarterly print of the financial year, and the first full…
- The comparison set.: Against Q1 FY26’s 6.9% — a strong acceleration year-on-year; against Q4 FY26’s revised 8.6% — a sequential moderation from an…
- The GDP-versus-GVA distinction.: GDP (the demand side plus net indirect taxes) against GVA at basic prices (the supply side) — the two move together but diverge when tax collections…
- The “fastest major economy” frame.: At 7.8% India remains the fastest-growing major economy — the standing context, with the caveat that the comparison set (China, the US, the…
- Manufacturing at 9.2%.: The print’s spearhead — consistent with the capex-and-investment momentum the PLI schemes, infrastructure push and corporate-bank credit have…
- Services strong.: The services composite (finance, trade, hotels, IT) carried the rest — the IT sector’s revival, the domestic demand resilience, the GST…
Have a doubt on this topic?