

Indian Migration and Remittances: How a Nation on the Move Transforms India
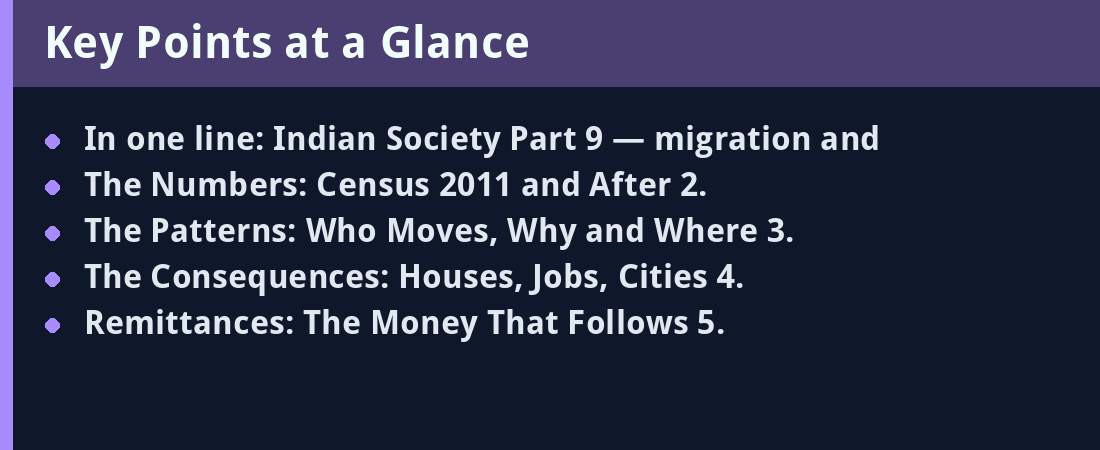
In one line: Indian Society Part 9 — migration and remittances, decoded.
- 1. The Numbers: Census 2011 and After
- 2. The Patterns: Who Moves, Why and Where
- 3. The Consequences: Houses, Jobs, Cities
- 4. Remittances: The Money That Follows
- 5. The Distress Record and COVID’s Lesson
- 6. The Policy Layer: Portability Reforms
- 7. Quick Revision: One-Glance Facts
- The Numbers Card
- Practice Corner: Five Definition Checks (with Answers)
- The Case Lens: The Migration Answer’s Grid
- The Three Classic Traps (Where Beginners Slip)
- Frequently Asked Questions
- How many migrants does India have?
- Why do Indians migrate internally?
- What role do remittances play?
- What did the COVID reverse migration reveal?
- What policy responses serve migrants?
- Exam Checklist
- FAQ
- How much of this page is exam-relevant?
- When should I revisit?
- The Thirty-Second Recap
- Explain It Simply
- Abbreviations That Recur Here
In one line: The migration chapter on one card: Census 2011’s 45 crore internal migrants (over a third of the population, marriage the biggest reason, work the male motor); the corridor geography — Bihar-UP-to-Delhi-Mumbai-Pune and the Gulf-and-global layer; remittances as the world’s largest inflow; the distress record from COVID’s reverse marches; and the portability reforms (One Nation One Ration Card, e-Shram, the labour codes) that the exam pairs with all of it.
The migration chapter stands on four counts. First, the numbers-and-patterns — who moves, why and where. Second, the causes-and-consequences — the development story beneath the flows. Third, the distress record — informality, COVID and the reverse march. Fourth, the policy layer — the portability reforms. Master these four panels and any migration question — prelims fact, mains theme or interview aside — resolves on the same framework.
Contents
1. The Numbers: Census 2011 and After
2. The Patterns: Who Moves, Why and Where
3. The Consequences: Houses, Jobs, Cities
4. Remittances: The Money That Follows
5. The Distress Record and COVID’s Lesson
6. The Policy Layer: Portability Reforms
7. Quick Revision: One-Glance Facts
– Practice Corner: Five Definition Checks (with Answers)
– The Case Lens: The Migration Answer’s Grid
Quick Answer: India is a nation on the move: Census 2011 counted about 45 crore internal migrants — over a third of the population — with marriage the largest single reason (dominating female migration) and work-and-employment the male motor; the corridors run Bihar-UP-Odisha to Delhi-Mumbai-Pune-Surat-Gujarat. Migration remits: internal remittances support origin households while India receives the world’s largest international remittances (a hundred-billion-dollar-plus annual inflow from the Gulf-and-global diaspora). The distress side — informal work, exclusion from destination services, COVID’s reverse-march — drives the portability reform agenda: One Nation One Ration Card, e-Shram, the labour codes’ portable benefits.
1. The Numbers: Census 2011 and After
- The headline count. Census 2011: roughly 45 crore migrants (about 37 per cent of the population), up sharply from 31 crore in 2001 — one in three Indians is a migrant by the census definition (change of usual residence). The decade-on-decade rise itself is the story: mobility deepened even as rural livelihoods stagnated, signalling that migration is less an anomaly and more a structural feature of the economy.
- The definitional caution. The census counts anyone who changed residence, including women moving on marriage within the same district — the “45 crore” is a broad umbrella, not a labour-migration count; the labour-migration universe (EUS-and-NSS estimates, which place economic migrants far lower) is the smaller core within it. Distinguishing the two definitions is a marks-earning precision.
- The marriage-dominance fact. Among reasons recorded: marriage accounts for about half of all migration (the overwhelming driver for women, near 90 per cent of female migrants cite it), work-and-employment for a smaller share but the overwhelming driver for men, followed by family movement. The gendered structure — women move for marriage, men for work — is the sociological core every answer should hold.
- The business and education strata. Beyond marriage, work and family, the census records migration for business, education and natural calamity — small shares that nonetheless matter for policy design: student migration shapes hostels-and-rental markets, distress migration shapes disaster-response planning.
- The data gap. The 2021 census’s postponement means 2011 remains the last full count — the policy-and-exam irony (decisions on a fifteen-year-old base) that mains answers on data-systems cite. Interim sources — the Periodic Labour Force Survey, e-Shram registrations, railway-and-SEWA-style studies — patch the gap, but none matches the census’s universal coverage.
2. The Patterns: Who Moves, Why and Where
- The streams (the census grid). Rural-to-rural (the largest stream by volume — marriage-dominated), rural-to-urban (the labour-and-aspiration stream), urban-to-urban (career churn), urban-to-rural (return-and-retirement); each stream’s gender-and-reason profile differs — the four-quadrant diagram that structures any answer. Draw it, label it, and half the question is answered before the introduction closes.
- The corridor geography. The Hindi-belt outflows (Uttar Pradesh, Bihar, Odisha, Jharkhand, Madhya Pradesh, Rajasthan) toward Delhi, Mumbai, Pune, Surat-Ahmedabad, Bengaluru, Chennai, and Punjab-and-Haryana’s farm belt; Kerala’s unique in-migration reversal (Bengal-and-Odisha workers filling its Gulf-drained labour market). Corridors are path-dependent — village-to-neighbourhood chains route newcomers to specific employers and localities, reproducing the flow year after year.
- The distance-and-duration grammar. Short-distance-and-seasonal moves (the brick-kiln-and-harvest circuits, Mahatma Gandhi NREGA’s counter-pull) versus permanent relocation; circular migration — repeated returns without settlement — as the dominant informal-labour reality. The Economic Survey’s estimate of intra-district dominance matters here: most migrants move short distances, not the metros the headlines imagine.
- The international layer. The Gulf corridor (semi-skilled construction-and-services, Kerala-Telangana-UP-and-Bihar’s origins), the Anglophone professional corridor (US-UK-Canada-Australia), and the new mobility-and-study flows (students as India’s fastest-growing “export”) — three diasporas with three remittance profiles: wage-based, salary-based and scholarship-family-based.
- The theoretical lens (the mains garnish). Lee’s push-pull model (origin push factors — landlessness, debt, drought; destination pull factors — wages, urban amenities, intervening obstacles), Todaro’s expected-income thesis, and the new economics of labour migration (household-level risk diversification rather than individual wage-maximisation) — one line each elevates an answer from descriptive to analytical.
3. The Consequences: Houses, Jobs, Cities
- The origin effects. Remittances-and-returns building origin-district economies (Punjab-and-Kerala’s historical cases, Bihar’s remittance-boom towns); the negative side — remittance dependency, “money without production”, the remittance-rents theses; and Left-behind households (women-headed agriculture — the “feminisation of agriculture” phrase fits here — elderly care, school-age disruption) — the sociological layer of the outflow.
- The destination effects. Cities built by migrant labour (construction, domestic work, delivery-platform work, small industry) alongside exclusion: informal settlements, service-access barriers (ration cards, voting, schooling documentation), and the political economy of the “outsider” narrative — the nativism episodes (Mumbai’s-and-Assam’s variant politics) the GS1-and-GS2 crossover cites. Migrants also send back aspirations — new consumption patterns, skills and social norms travel the return journey, the quieter diffusion channel development literature celebrates.
- The labour-market dualism. Migrants over-represented in the informal economy’s hardest segments — construction, brick kilns, street vending, home-based work; the wage-and-condition penalties (the Inter-State Migrant Workmen Act’s 1979 framework — registration of contractors, journey allowance, displacement allowance, wage parity — largely unenforced until the codes era, was the sector’s paper shield). Networks matter too: migrants concentrate in niche trades (Bengali workers in fish markets, Odia workers in Surat’s textile mills), trading autonomy for access.
- The urban-load question. Migration strains water, housing and transport in destination cities — the standard answer — but the evidence cautions against the “migrants-burden-cities” framing: migrants subsidise the city with labour while being under-served by it. A balanced paragraph here reads as nuance, not apology.
- The demographic dividend read. Migration is the dividend’s plumbing — young workers moving to where the work is; a society that blocks or burdens the flow taxes its own growth — the mains thesis. States exporting labour gain remittances but defer the dividend’s local harvest; states importing it gain the harvest and the service-load. Fiscal transfers and portability are how federalism squares that circle.
4. Remittances: The Money That Follows
- The world record. India receives the world’s largest international remittances — $129 billion-plus in calendar 2024 (the third consecutive year above $100 billion) and a record $135 billion in FY25 per RBI data (FY25, April–March) — from the Gulf-and-global diaspora; Kerala’s-and-Punjab’s historical dependence, the Hindi-belt-and-south’s rising share as corridors diversified — the US-UK professional corridor now rivals the Gulf in the state-level mix.
- The internal layer. Internal remittances (the domestic migrant-to-origin flows) rival-or-exceed international ones in household coverage — the (state-level surveys-and-studies) flows supporting Bihar-UP-Odisha’s rural economies; both layers matter, the exam’s either-or trap. A household in Gaya may bank on a son in Delhi as much as a household in Thrissur banks on a nurse in Dubai.
- The economics of remittances. Stable, counter-cyclical, current-account-supporting (the BoP chapter’s secondary-income line) — unlike FDI or portfolio flows, remittances rise when origin households face distress, making them the developing world’s most reliable external flow; the “brain drain versus brain gain” debate (diaspora networks, returnee entrepreneurship, the knowledge flows alongside the money, schemes from PIO-and-OCI cards to the Pravasi Bharatiya Divas platform) frames the policy response.
- The cost-and-channel layer. Falling transfer costs (digital rails, UPI-linked corridors), the RBI’s rules on inflows under the Liberalised Remittance Scheme’s inbound mirror, and the formal-versus-hawala margin — the financial-inclusion footnote that current-affairs occasionally tests. Every percentage point shaved off transfer fees is a direct transfer to origin households — the arithmetic worth quoting.
- The uses at origin. Remittances typically fund consumption smoothing first (food, health, school fees), then housing (the Kerala-and-Punjab “remittance bungalow” landscape), then productive assets — the sequencing that explains why remittance economies show prosperity markers alongside weak local industry.
5. The Distress Record and COVID’s Lesson
- The pre-pandemic baseline. Informal contracts, wage theft-and-bonded-labour residue, housing exclusion (night shelters-and-pavement realities), and identity-document barriers — the everyday exclusion stack of the circular migrant, compounded by no access to destination entitlements even while paying destination taxes.
- The COVID reverse march (2020). The lockdown’s jobless millions walking home — the images that made circular migration visible to policy; the Shramik trains, the relief codes, the Atmanirbhar package’s migrant provisions (free food grains, MGNREGA expansion, affordable rental housing announced), and the post-exodus commissions (the Supreme Court’s interventions on migrant registration-and-food) — the case every GS answer now cites.
- The lesson institutionalised. The crisis exposed that India’s welfare state was resident-based while its workforce was mobile — the portability diagnosis that Section 6’s reforms answer. Food, identity, insurance and social-security entitlements all assumed a stationary beneficiary; the reverse march was the system’s stress test, and the system failed it.
- The return-and-re-migration arc. Post-2020, the flows rebuilt (destination cities’ labour shortages pulled workers back), but with wage-and-condition premiums at the margin and some states (Jharkhand, Bihar, UP) launching returnee-registration and local-employment drives — the market’s own correction, incomplete and uneven.
6. The Policy Layer: Portability Reforms
- One Nation One Ration Card (ONORC). Ration-portability across states — the migrant’s food-grain access at any fair-price shop nationwide, powered by the end-to-end digitisation of the Public Distribution System and biometric authentication; the reform most directly born of the migrant’s exclusion.
- e-Shram. The national database of unorganised workers (the 30-crore-plus registrations milestone) — the identification-and-delivery layer for benefits, accident insurance and the future’s portability architecture; a universal registration is the precondition for universal portability, which is why e-Shram is the stack’s foundation rather than a footnote.
- The labour codes. The four codes (2025’s notified-and-in-force status this site’s Labour Codes post covers) — the Occupational Safety, Health and Working Conditions Code replacing the Inter-State Migrant Workmen Act with journey-allowance, wage-and-welfare provisions, plus a formal definition of the inter-state migrant; the Code on Social Security’s gig-and-platform coverage (migrant-heavy segments) extends the first statutory safety net to the delivery-and-cab workforce.
- The housing-and-schooling layer. The Affordable Rental Housing Complexes scheme (converted from the cancelled ARHC-adjacent drives of 2020) targets worker housing near workplaces; seasonal hostels and the migration cards under the Right to Education framework address children’s discontinuity — partial answers to the schooling question every rural outflow raises.
- The remaining agenda (the mains verdict). Portability of voting (the migrant’s ballot question — the EC’s experiments with remote voting remain unlegislated), rental-housing scale, schooling continuity for migrant children, and inter-state benefit coordination — the half-finished list that keeps this chapter current-affairs-alive.
7. Quick Revision: One-Glance Facts
- Scale. Census 2011: ~45 crore migrants (~37% of population); marriage the top reason, work the male motor.
- Streams. Rural-to-rural largest; rural-to-urban the labour stream; circular migration the informal reality.
- Corridors. Bihar-UP-Odisha → Delhi-Mumbai-Pune-Surat; Kerala’s in-migration reversal; the Gulf-and-global diasporas.
- Remittances. World’s largest international inflow ($100-billion-plus, ~3% of GDP) plus the internal remittance economy.
- Policy. ONORC, e-Shram, labour codes; voting-and-housing portability the unfinished layer.
- Theory hook. Push-pull (Lee), expected income (Todaro), household risk-diversification (new economics of migration) — one line each for mains.
Conclusion. Migration is India’s dividend in motion and its exclusion in mirror: 45 crore people moving (marriage-and-work), remitting (world-record sums), building destination cities while origin districts live on their transfers — and a policy state learning, one portable benefit at a time, to serve a mobile nation with a resident-based machine. The chapter’s numbers age; the grid does not.
The Numbers Card
| Metric | Value | Source |
|---|---|---|
| Migrants (2011) | ~45 crore (37%) | Census |
| Remittances CY2024 | $129 bn+ | World Bank |
| Remittances FY25 | $135.46 bn | RBI |
| e-Shram | 30 crore+ | Govt |
Practice Corner: Five Definition Checks (with Answers)
- The census’s largest single reason for migration is — Marriage (about half of all migrants, overwhelmingly women).
- The largest migration stream by volume is — Rural-to-rural (marriage-dominated), not rural-to-urban.
- India’s international remittances rank — First in the world (past $100 billion annually; $135 billion in FY25 per RBI).
- ONORC delivers — Nationally portable ration-card access for migrants at any fair-price shop.
- The COVID reverse march (2020) exposed — The welfare state’s residence-based design against a mobile workforce — the portability diagnosis.
The Case Lens: The Migration Answer’s Grid
Every migration question — a nativism episode, a remittance milestone, a portability scheme — resolves on the same grid: the numbers (census-and-survey layer), the pattern (stream-and-corridor), the consequence (origin-and-destination effects), and the policy (portability stack). Four panels, one thesis: a mobile nation needs a portable state — the conclusion that fits every variant the exam constructs. Practise by taking any recent headline — a metro construction boom, a state’s worker-registration drive, a remittance record — and forcing it into the four panels; the grid does the structuring so the answer does not ramble.
The Three Classic Traps (Where Beginners Slip)
“45 crore labour migrants.” The census count includes marriage-and-family moves; the labour-migration core is far smaller. The umbrella-versus-core distinction is the precision that separates bands.
“Rural-to-urban is the biggest stream.” By volume, rural-to-rural leads (the marriage effect); rural-to-urban leads in economic salience. The question’s wording decides which truth answers it.
“Remittances mean the Gulf only.” The Gulf is the historic core; the Anglophone professional corridor and the internal remittance economy are the diversification story. One corridor answers, full marks do not.
Frequently Asked Questions
How many migrants does India have?
Census 2011 counted about 45 crore internal migrants — over a third of the population — though this includes marriage-and-family movement; the labour-migration universe within it is substantially smaller. With the 2021 census deferred, 2011 remains the latest universal count.
Why do Indians migrate internally?
Marriage is the largest single reason (dominating women’s migration); work and employment drive male migration; family movement, education and distress complete the causes — with rural-to-urban corridors running from the Hindi belt and Odisha to the metro-and-industrial destinations.
What role do remittances play?
International remittances make India the world’s largest recipient (a hundred-billion-dollar-plus annual inflow supporting the current account and origin states), while internal remittances sustain millions of origin-district households — two layers of the same money-map.
What did the COVID reverse migration reveal?
The 2020 lockdown’s jobless exodus exposed the circular migrant’s everyday precarity — informal work, no destination entitlements, no safety net — and the portability gaps in a residence-based welfare state.
What policy responses serve migrants?
The portability stack: One Nation One Ration Card (food), e-Shram (worker registration and benefits), the labour codes’ migrant provisions (journey allowance, welfare), with voting rights, housing and schooling access as the acknowledged unfinished agenda.
Related on hmmnm.in: Indian Society Part 7: Elderly, Disability, Security · Indian Society Part 6: Slums, Hawkers, Housing · Indian Society Part 5: Poverty Lines to the MPI
Read next: Indian Society Part 8: Communalism Data (series archive)
Exam Checklist
- Therefore, revise the article table vertically
- Pair each number with its office
- Write one mains-skeleton weekly
- In addition, teach the page to a peer in three minutes
- Revisit on Sunday with the quiz

FAQ
How much of this page is exam-relevant?
Nearly all of it, because the tables and worked items follow the standard question register for this subject.
When should I revisit?
Day three and day seven after the first read, with the drill spoken aloud once.
The Thirty-Second Recap
One page. One topic. Therefore, read the tables twice. Speak the recap once. Moreover, the numbers carry the marks. The names carry the traps. However, revisits beat rereads. Finally, day three and day seven. That is all.
Explain It Simply
Think of this page as a map of one neighbourhood. The big streets are the tables. The landmarks are the numbers. The street names are the terms in bold. However big the city feels, this one neighbourhood fits in a pocket, and a pocket map is what exam week needs. Therefore, walk it once fully, then walk only the streets you forget, and by the second walk the neighbourhood feels like home.
Pocket the map, not the whole city: exams reward the walkable version of every topic.

Abbreviations That Recur Here
- UP.
- EUS.
- NSS.
- NREGA.
- US.
Quick revision
- The headline count.: Census 2011: roughly 45 crore migrants (about 37 per cent of the population), up sharply from 31 crore in 2001 — one in three Indians is a migrant…
- The definitional caution.: The census counts anyone who changed residence, including women moving on marriage within the same district — the “45 crore” is a broad…
- The marriage-dominance fact.: Among reasons recorded: marriage accounts for about half of all migration (the overwhelming driver for women, near 90 per cent of female migrants cite…
- The business and education strata.: Beyond marriage, work and family, the census records migration for business, education and natural calamity — small shares that nonetheless matter…
- The data gap.: The 2021 census’s postponement means 2011 remains the last full count — the policy-and-exam irony (decisions on a fifteen-year-old base) that…
- The streams (the census grid).: Rural-to-rural (the largest stream by volume — marriage-dominated), rural-to-urban (the labour-and-aspiration stream), urban-to-urban (career…
Have a doubt on this topic?